These are pleasingly simple, and the plots can be generated with two or three lines of GNU Octave (Matlab if you prefer) code.
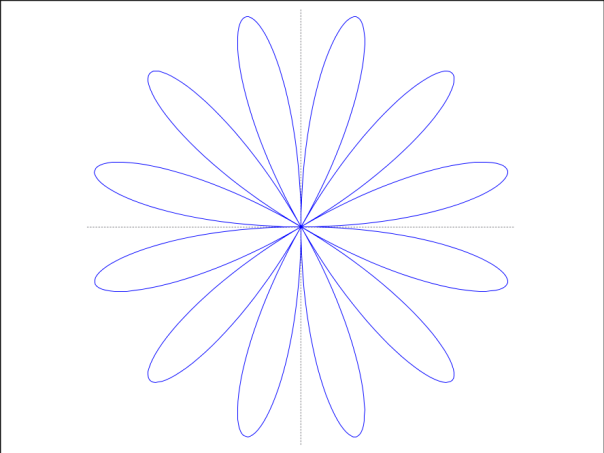
- r=sin(6θ), θ=0..2π
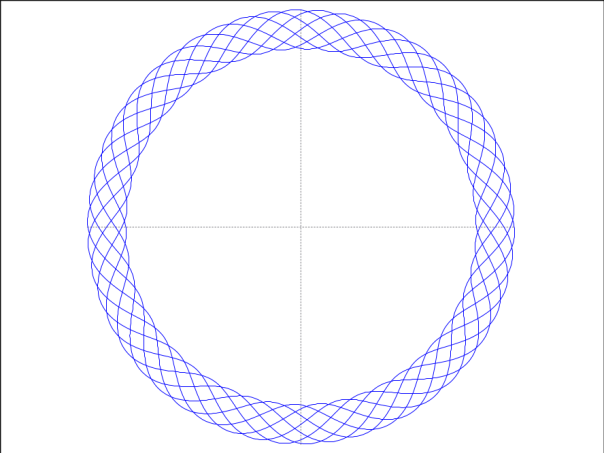
- r=1+0.1 sin (50 θ/7), θ=0..14π
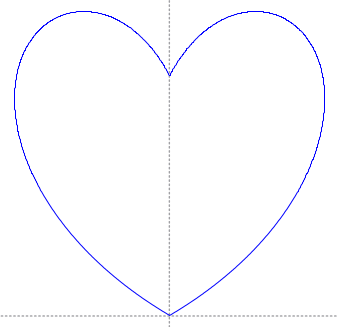
- r = 12 + 0.4 |θ-90|-0.01|θ-90|^2, θ = 30˚ .. 150˚
These are pleasingly simple, and the plots can be generated with two or three lines of GNU Octave (Matlab if you prefer) code.
